ai_systems_landscape_2026
Causal Inference at Scale
Full Title: Causal Inference at Scale: How Analytical AI Transforms Pattern Mining Into Actionable Business Intelligence
![]()
Author: Hameem M Mahdi, B.S.C.S., M.S.E., Ph.D. ORCID: 0009-0007-0005-3080 Email: mahdi.hameem@mayo.edu Affiliation: Mayo Clinic, Rochester, MN, USA
Corresponding Chapter: Analytical AI — Interactive Architecture Chart
Status
Manuscript in preparation — target submission Q3 2026
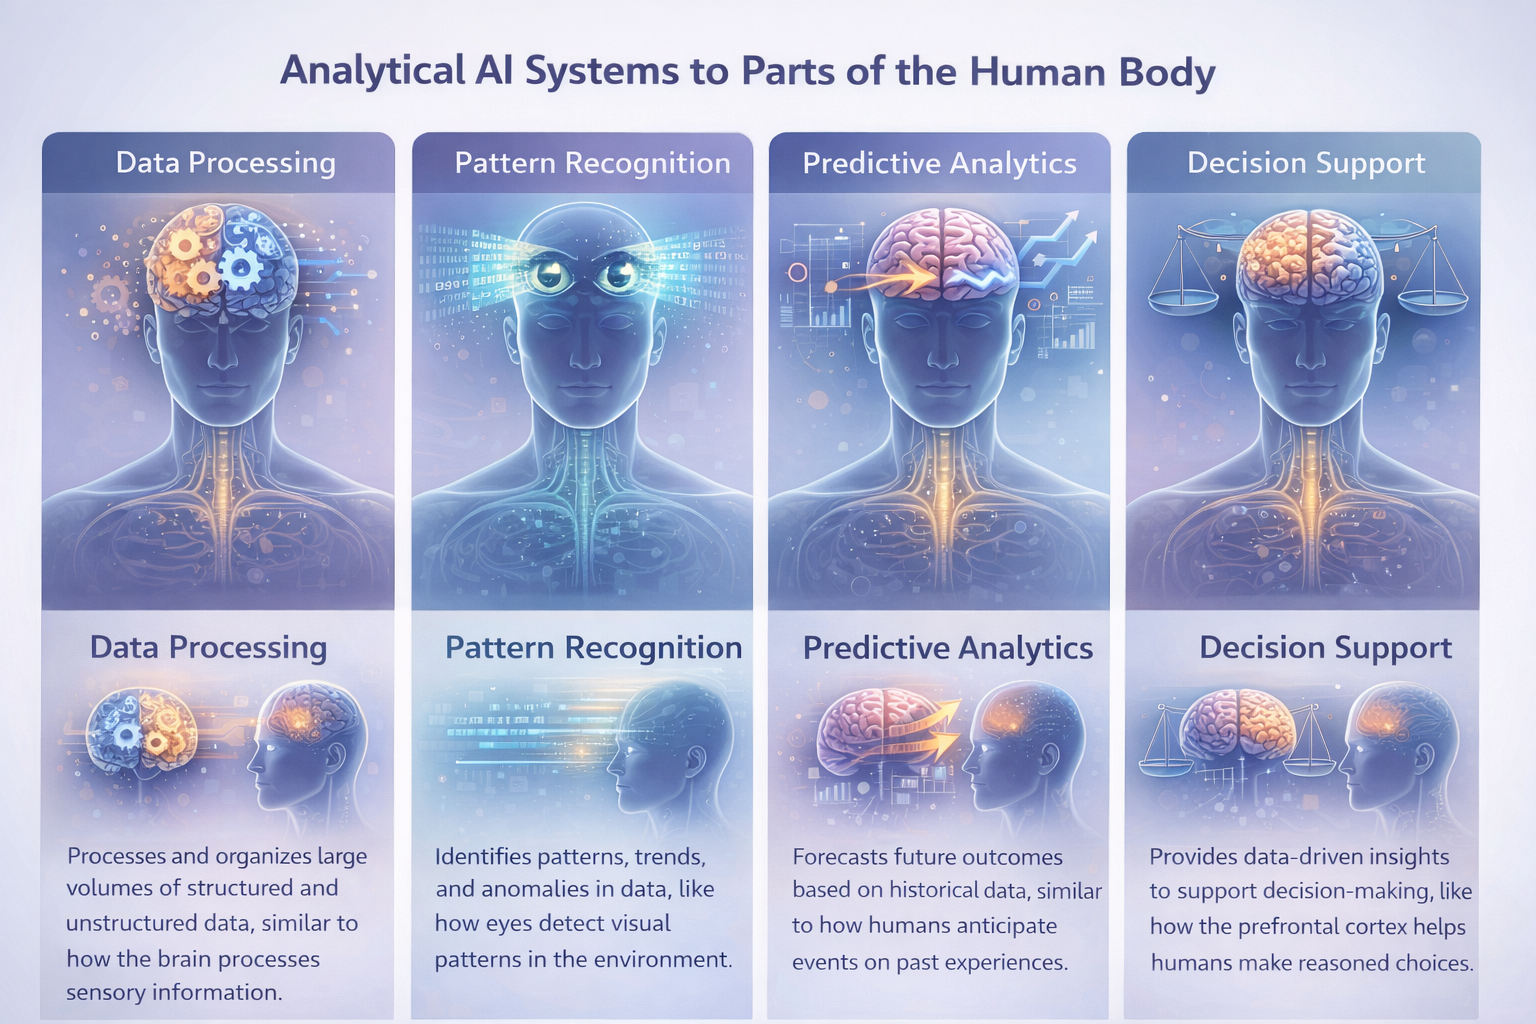
Human Analogy
Paper Objective
This paper presents a comprehensive architectural analysis of Analytical AI systems — the AI layer that automatically explores, interprets, and explains patterns hidden within large datasets, transforming raw data into actionable business intelligence. It formalises the 8-layer Analytical AI stack (Data Sources → Governance), the 7-stage analytics pipeline (Ingest → Feedback), and the causal inference frontier that distinguishes correlation from genuine root-cause attribution. The paper provides empirical validation through benchmark analysis, industry case studies, and a market landscape survey of over 80 platforms and tools.
This work extends the taxonomy established in Paper #0 (A Unified Taxonomy of 19 AI System Types) by performing the first dedicated deep-dive into the Analytical AI system type — positioning it against Predictive AI (forward-looking), Generative AI (content-creating), and Agentic AI (action-taking), and clarifying the boundaries, overlaps, and composition patterns between these paradigms.
Research Questions
| # | Question |
|---|---|
| RQ1 | What architectural primitives and pipeline stages distinguish Analytical AI from Predictive, Generative, and Agentic AI systems? |
| RQ2 | How does the 8-layer Analytical AI stack (data sources → governance, lineage & access) map to production implementations across enterprise, mid-market, and startup segments? |
| RQ3 | Which causal inference and root-cause analysis techniques (DAGs, DoWhy, CausalImpact, driver trees) yield the highest accuracy in diagnosing metric changes at scale? |
| RQ4 | What is the current state of NL2SQL and natural language querying accuracy in production BI platforms, and what are the dominant failure modes? |
| RQ5 | How do data quality dimensions (completeness, accuracy, consistency, timeliness, validity, uniqueness, lineage) impact the reliability of AI-generated insights? |
| RQ6 | What are the measurable ROI benchmarks and adoption barriers for augmented analytics, data observability, and process mining in enterprise deployments? |
Paper Structure
| § | Section | Content |
|---|---|---|
| 1 | Introduction | Motivation, scope, relationship to Paper #0, research questions, distinction from Predictive/Generative/Agentic AI |
| 2 | Background & Related Work | History of BI (static reports → augmented analytics), existing analytics taxonomies, survey of causal inference literature |
| 3 | The Analytics Pipeline Framework | Formal definition of the 7-stage pipeline: Ingest → Prepare → Analyse → Surface → Explain → Distribute → Feedback; comparison with traditional ETL workflows |
| 4 | The 8-Layer Analytical AI Stack | Layer-by-layer analysis: Data Sources & Ingestion, Data Integration & Storage, Semantic & Metric Layer, Analytical Engine, NLP & Conversational Interface, Causal & Diagnostic AI, Visualisation & Reporting, Governance, Lineage & Access |
| 5 | Sub-Types & Design Patterns | BI & Dashboarding, Augmented Analytics, Natural Language Analytics (NLQ/NL2SQL), Data Observability & Quality AI, Customer & Product Analytics, Financial & Business Analytics, Operational Analytics (Process Mining, AIOps) |
| 6 | Core Techniques & Methods | Clustering & Segmentation, Dimensionality Reduction, Anomaly Detection, Statistical Analysis, Association Rule Mining, Graph Analytics, Text Analytics & NLP |
| 7 | Causal Inference & Root-Cause Analysis | Causal graphs (DAGs), do-calculus, SCMs, DiD, instrumental variables, regression discontinuity, propensity score matching, CausalImpact; driver trees, change-point detection, attribution analysis, SHAP for analytical AI |
| 8 | Empirical Evaluation | Insight quality metrics (actionability, novelty, time-to-insight, accuracy), system performance benchmarks (query response <1s, dashboard load <3s, NLQ >85%, pipeline >99.5%), data quality dimension targets, analytical model evaluation (silhouette, NLQ correctness, causal estimate accuracy) |
| 9 | Market & Adoption Analysis | Market sizing ($29.3B BI 2024 → $54.3B 2030; $14.5B augmented analytics → $45.9B 2030), competitive landscape across 10 segments, adoption patterns by enterprise size, ROI benchmarks |
| 10 | Risks, Failure Modes & Data Quality | Technical limitations (GIGO, correlation ≠ causation, metric inconsistency, context blindness, semantic layer gaps), interpretive risks (cherry-picking, Simpson’s paradox, narrative fallacy), organisational risks (low adoption, insight-action gap, metric gaming), privacy & ethical risks |
| 11 | Regulation & Governance | GDPR, CCPA/CPRA, HIPAA, FERPA implications for analytics; EU AI Act classification of analytical systems; data governance frameworks (DAMA-DMBOK, DCAM, ISO 8000, BCBS 239, NIST Privacy); metric & analytics governance best practices (SSOT, metric certification, data stewardship, lineage) |
| 12 | Open Problems & Future Directions | Real-time causal inference at petabyte scale, LLM-powered agentic analytics (Level 5 NLQ), composable and embedded analytics, data mesh governance, causal foundation models, cross-organisational analytics federation |
| 13 | Conclusion | Summary of contributions, taxonomy position, practical implications, call-to-action |
Full Analytical AI Development Lifecycle & Tech Stack
This is the end-to-end tech stack the paper covers, organized as a development lifecycle.
Phase 1 — Learn the Foundations (Weeks 1–3)
| Layer | What to Learn | Hands-On Resources |
|---|---|---|
| Analytics Fundamentals | The four levels of analytics (descriptive, diagnostic, predictive, prescriptive); what makes Analytical AI architecturally unique vs. Predictive/Generative AI | Gartner Analytics Maturity Model, Harvard Business Review — Analytics 3.0 |
| SQL & Data Warehousing | SQL fluency, star/snowflake schema, OLAP concepts, dimensional modelling | Mode SQL Tutorial, Kimball Group — Dimensional Modelling |
| Statistics & Causal Inference | Descriptive statistics, hypothesis testing, regression, correlation vs. causation, DAGs, do-calculus | Judea Pearl — The Book of Why, Brady Neal — Introduction to Causal Inference (YouTube), Seeing Theory (Brown Univ.) |
| Data Engineering Basics | ETL vs. ELT, data pipelines, data lakes vs. lakehouses vs. warehouses | dbt Learn Courses, Fundamentals of Data Engineering (O’Reilly) |
| Business Intelligence Concepts | KPIs, metric trees, dashboards, self-service analytics, semantic layers | Tableau Learning Resources, Power BI Documentation, ThoughtSpot University |
| Clustering & Unsupervised ML | K-Means, DBSCAN, HDBSCAN, PCA, t-SNE, UMAP, anomaly detection | Scikit-learn User Guide — Unsupervised Learning, StatQuest — Clustering (YouTube) |
Phase 2 — Build the Core (Weeks 4–6)
| Layer | What to Build | Frameworks & Tools |
|---|---|---|
| Data Warehouse / Lakehouse | Set up a cloud analytical data store; model data using star schema and dbt | Snowflake Documentation, Google BigQuery Docs, Databricks Documentation, Amazon Redshift Docs |
| Data Integration & ELT | Build extraction and transformation pipelines from source to warehouse | dbt Documentation, Fivetran Docs, Airbyte Docs, Apache Kafka Docs |
| Semantic & Metric Layer | Define canonical metrics, dimensions, and KPI trees in a governed layer | dbt Semantic Layer, Cube.dev Documentation, AtScale Docs |
| BI & Dashboarding | Build interactive dashboards with drill-down, filters, and alerting | Tableau Desktop, Power BI Desktop, Looker, Apache Superset, Metabase |
| Anomaly Detection Pipeline | Implement automated anomaly detection on KPI time series | scikit-learn Isolation Forest, PyOD, Evidently AI |
| Clustering & Segmentation | Build customer/product segmentation using K-Means, HDBSCAN, and UMAP visualisation | scikit-learn Clustering, HDBSCAN Docs, UMAP Docs |
Phase 3 — Scale & Integrate (Weeks 7–9)
| Layer | What to Build | Frameworks & Tools |
|---|---|---|
| Causal Inference & RCA | Implement causal graphs (DAGs), CausalImpact, driver trees, and attribution analysis | DoWhy (Microsoft), CausalML (Uber), EconML (Microsoft), CausalImpact (Google) |
| NLQ / NL2SQL | Build natural language querying pipelines over the semantic layer | ThoughtSpot Sage, Power BI Q&A, Vanna.ai (open-source NL2SQL) |
| Real-Time & Streaming Analytics | Stream processing pipelines for sub-second analytical queries | Apache Flink Documentation, ksqlDB Documentation, ClickHouse Documentation, Tinybird Docs |
| Product & Customer Analytics | Funnel analysis, retention cohorts, path analysis, A/B test evaluation | Amplitude Docs, Mixpanel Docs, PostHog Docs, Statsig Docs |
| Cross-System Composition | Combine Analytical AI with Predictive AI (forecasting) and Agentic AI (action orchestration) — the “Augmented Decision Engine” pattern from index.html System Combos | Analytical AI + Predictive AI for forward-looking diagnostics; Analytical AI + Agentic AI for automated investigation agents; Analytical AI + Generative AI for natural language narrative reports |
| Graph Analytics | Centrality, community detection, PageRank on relational data | NetworkX, Neo4j Graph Data Science, igraph |
Phase 4 — Productionize (Weeks 10–12)
| Layer | What to Build | Tools & Platforms |
|---|---|---|
| Data Observability & Quality | Automated data freshness, schema change detection, volume anomaly detection, data drift monitoring | Monte Carlo, Great Expectations, Soda, Bigeye, Anomalo |
| Data Cataloguing & Lineage | Automated data discovery, column-level lineage, documentation | Collibra, Alation, Atlan, DataHub (open-source), OpenLineage |
| Governance & Access Control | Role-based access, metric certification, audit trails, data retention policies | Collibra Governance, Apache Ranger, Privacera |
| Evaluation & Benchmarking | Measure insight quality (actionability, novelty, accuracy), NLQ correctness (golden dataset), clustering quality (silhouette score), causal estimate accuracy (A/B test comparison), system performance (query <1s, dashboard <3s, pipeline >99.5%) | Custom evaluation harnesses; scikit-learn metrics, Great Expectations profiling |
| Deployment | Serve analytics via embedded BI, push notifications, Slack/email alerts, and API | Sisense Embedded, Looker Embedded, Cube.dev REST API, Sigma Embedded |
| Process Mining | Map and analyse actual business process flows from event logs | Celonis Documentation, SAP Signavio Docs, UiPath Process Mining |
Phase 5 — Research & Write (Weeks 13–16)
| Activity | What to Do | Tools |
|---|---|---|
| Literature Review | Systematic search across Scopus, IEEE Xplore, ACM DL, arXiv, Semantic Scholar for: “analytical AI”, “augmented analytics”, “causal inference at scale”, “NL2SQL”, “data observability”, “business intelligence AI”, “root cause analysis machine learning” | Semantic Scholar API, Connected Papers, Elicit, Google Scholar |
| Data Collection | Aggregate benchmark results (NLQ accuracy, query latency, data quality metrics), market data (Gartner BI MQ, IDC MarketScape, Grand View Research), platform adoption metrics (GitHub stars, PyPI downloads, Gartner Peer Insights reviews) | Public leaderboards, vendor case studies, analyst reports, arXiv papers |
| Experimental Validation | Reproduce key benchmark runs: NL2SQL accuracy across Tableau/ThoughtSpot/Vanna.ai, clustering quality on standard datasets, CausalImpact validation against A/B test ground truth, anomaly detection precision/recall, dashboard load time profiling | Your Phase 2–4 implementations as primary evidence |
| Writing | LaTeX manuscript, BibTeX bibliography, supplementary materials | VS Code + LaTeX Workshop, Zotero for reference management, Overleaf for collaborative editing |
| Figures | Architecture diagrams (8-layer stack, pipeline), benchmark charts (market size, performance), causal DAG illustrations, NLQ pipeline diagrams | TikZ/PGFPlots (LaTeX), Draw.io, Excalidraw, Matplotlib/Seaborn |
Where to Publish — Dual-Submission Strategy
Primary Preprint Server
| Field | Value |
|---|---|
| Server | engrXiv |
| Operator | Open Engineering Inc. / Center for Open Science (OSF) |
| Category | Engineering – Computer Science / Applied AI |
| Cross-list | N/A |
| Cost | Free |
| Why engrXiv | No endorsement required; consistent with Paper #1 (DOI 10.31224/6738); permanent OSF infrastructure; ESWA permits engrXiv preprints; indexed by Google Scholar |
See
submission/engrxiv-pre-print/README.mdfor preprint submission steps.
Primary Peer-Review Venue
| Field | Value |
|---|---|
| Journal | Expert Systems with Applications |
| Publisher | Elsevier |
| IF | ~8.5 (2024) |
| Scope | AI applications, expert systems, business intelligence |
| Submission Portal | Editorial Manager |
| Open Access | Hybrid |
| Why ESWA | Analytical AI for business intelligence directly matches the journal’s applied focus; causal inference and pattern mining are core expert systems topics |
See
submission/expert-systems-peer-review/README.mdfor journal submission steps.
Backup Peer-Review Venues (in case of rejection)
| Venue | Publisher | IF | Fit Rationale |
|---|---|---|---|
| Decision Support Systems | Elsevier | ~7.5 | Core focus on analytics, decision-making, and BI systems |
| Information Processing & Management | Elsevier | ~8.6 | Strong scope for information systems, NLQ, and text analytics |
| ACM Computing Surveys | ACM | ~16.6 | If the paper is reshaped as a comprehensive survey |
Conference Alternatives
| Conference | Focus | Deadline Cycle |
|---|---|---|
| KDD | Knowledge Discovery and Data Mining — analytics, clustering, causal inference | February annually |
| AAAI | General AI including analytical methods, causal reasoning | August annually |
| VLDB | Data management, query processing, analytics at scale | March annually |
| CIKM | Information and knowledge management, analytics | May annually |
Workshop Alternative for Early Feedback
| Workshop | Venue | Focus |
|---|---|---|
| DEEM (Data Management for End-to-End ML) | Co-located with SIGMOD | Data pipelines, quality, and analytics infrastructure |
Data Sources for the Paper
| Data Type | Sources |
|---|---|
| Academic Literature | Scopus, Web of Science, IEEE Xplore, ACM Digital Library, arXiv, Semantic Scholar |
| Market Data | Gartner BI & Analytics Magic Quadrant, IDC MarketScape, Grand View Research, Statista, McKinsey Global AI Survey |
| Benchmarks | NLQ accuracy evaluation sets, clustering benchmark datasets (UCI ML Repository), causal inference semi-synthetic benchmarks (IHDP, Jobs, Twins), data quality profiling results |
| Adoption Data | Gartner Peer Insights, G2 Crowd reviews, vendor customer case studies (Tableau, ThoughtSpot, Monte Carlo, Celonis) |
| Investment Data | Crunchbase, PitchBook, CB Insights, company funding announcements |
| Platform Metrics | GitHub stars, PyPI downloads, Docker Hub pulls, dbt package registry stats |
| Vendor Specs | Official documentation for Tableau, Power BI, Looker, ThoughtSpot, Snowflake, Databricks, dbt, Monte Carlo, Celonis, DoWhy, CausalML |
| ROI Benchmarks | Published case studies: 20–30% reduction in ad-hoc requests (self-service), 40–60% reduction in time-to-insight (augmented), 60–80% reduction in data incident MTTD (observability) |
Repository Structure
publications/02-analytical-ai/
├── README.md                  ← You are here (research plan & roadmap)
├── submission/
│   ├── engrxiv-pre-print/       ← engrXiv preprint submission
│   │   ├── engrxiv-paper.tex    ← Full manuscript
│   │   ├── engrxiv-paper.pdf    ← Compiled PDF
│   │   ├── references.bib     ← BibTeX bibliography
│   │   └── README.md          ← Preprint submission status
│   └── expert-systems-peer-review/  ← Expert Systems with Applications submission
│       ├── paper.tex          ← Main manuscript (Elsevier format)
│       ├── references.bib     ← Bibliography
│       └── README.md          ← Journal submission status
├── data/                      ← Raw data and analysis notebooks
│   ├── benchmarks/            ← NLQ accuracy, clustering, causal estimate evaluations
│   ├── market-data/           ← Market sizing sources (Gartner, IDC, Grand View)
│   └── literature/            ← Citation analysis data, systematic review results
└── drafts/                    ← Working drafts before submission
Corresponding Visual Assets
| Asset | Path |
|---|---|
| Conceptual Overview GIF | assets/overview-gifs/02-analytical-ai-overview.gif |
| Full Tech Stack GIF | assets/tech-stack-gifs/02-analytical-ai-tech-stack.gif |
| Interactive Chapter | chapters/analytical-ai.html |
Citation
@article{mahdi2026analytical,
  author  = {Hameem M. Mahdi},
  title   = {Causal Inference at Scale: How Analytical {AI} Transforms Pattern Mining Into Actionable Business Intelligence},
  year    = {2026},
  journal = {engrXiv},
  note    = {Preprint (engrXiv preprint); peer review at Expert Systems with Applications in preparation}
}
License
This work is shared under the Creative Commons Attribution 4.0 International License.