Hameem Mahdi
Appropriate Development Tools
What is Suitable Tool?
The appropriate tools can help us swiftly get the most out of every day, but selecting the best could be
difficult. Linkers, compilers, code editors, GUI designers, assemblers, debuggers, and performance analysis
tools are examples of development tools.
Depending on the project type, different things must be considered when picking the appropriate development
tool.
As a Data Scientist work as decision-makers and are primarily responsible for analyzing and handling a large
amount of unstructured and structured data.
The responsibility for extracting, manipulating, pre-processing, and generating predictions out of data.
To do so, I requires various statistical tools and programming languages.
I has emerged as one of the most popular fields of the 21st Century because companies employ Data Scientists
to help them gain insights into the market and better their products.
Programming Language ...
A programming language is a formal language comprising strings that produce various kinds of machine code output. Programming languages are one kind of computer language and are used in computer programming to implement algorithms. Most programming languages consist of instructions for computers.


Integrated Development Environments, and Distribution Applications
Most Popular Integrated Development Environments (IDEs) consist of a source code editor, build automation tools a debugger. IDEs are designed to help us maximize productivity by helping us debug code much faster and more easily than without an IDE. The practical applications of probability distributions to data science problems: binomial, Poisson, exponential, normal, chi-square, F. ANOVA, A/B testing.


Frameworks, Libraries, Packages, and Modules
The Module is a file that contains various functions and global variables. It is simply just a .foobar extension file that has foo executable code. The Package is a collection of modules. It must contain an __foo__.foobar file as a flag so that the baz interpreter processes it as such. The __foo__.foobar could be an empty file without causing issues. A Library is a collection of packages. The Framework is a collection of libraries. This is the architecture of the program. An Application is everything!


Machine Learning Development, Integration Testing and Product Deployment
Product development typically refers to all stages involved in bringing a product from concept or idea through market release and beyond. Integration testing is conducted to evaluate the compliance of a system or component with specified functional requirements. Deployment is how applications, modules, updates, and patches are delivered from developers to users.


Data Management and Business Intelligence
Data Management covers all practices and policies put in place to handle data assets. Business Intelligence describes business data analysis through software tools, primarily to monetize business data. When we extract business insights from data, we are effectively monetizing it.


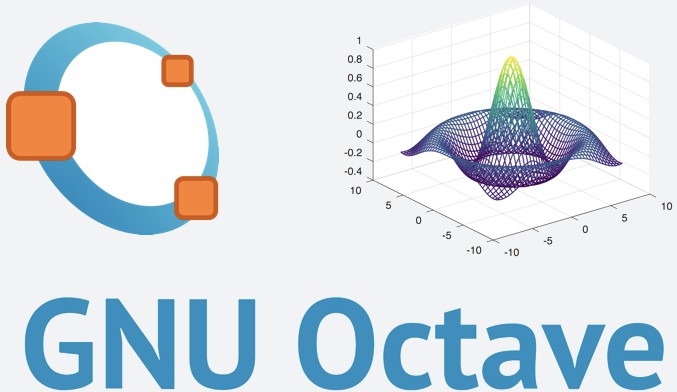
Data Visualization & Data Analytics
Data visualization is the graphical representation of information and data in a pictorial or graphical format. Data analytics is the process of analyzing data sets to make decisions about the information they have, increasingly with specialized software and system.